Home Services Portfolio Blog Trainings Contact Hire Me

Tracking a Fast-Moving Pandemic

During the COVID-19 pandemic, organizations needed a way to monitor daily case counts across countries without manually downloading and reformatting spreadsheets every day. The data was publicly available on GitHub (Johns Hopkins CSSE), but turning raw CSV files into an actionable daily briefing required significant manual effort.

The goal was to build a zero-maintenance Excel tool that anyone could open to get an up-to-date summary — complete with charts, country breakdowns, and a print-ready PDF — without writing a single line of code or touching a browser.

What the Tool Does

Live Data Refresh

Pulls the latest case data directly from the web every time the workbook is opened — no manual downloads or copy-pasting required.

Country-Level Breakdown

Shows new cases and cumulative totals for every country, with detailed tables that update automatically as new data arrives.

Dynamic Charts

Pivot charts visualize trends over time and compare countries — all linked to the live data so they refresh automatically.

Printable PDF Report

A formatted worksheet generates a print-ready PDF with calculated totals, dynamic charts, and detailed country tables — ready to share or print daily.

Under the Hood

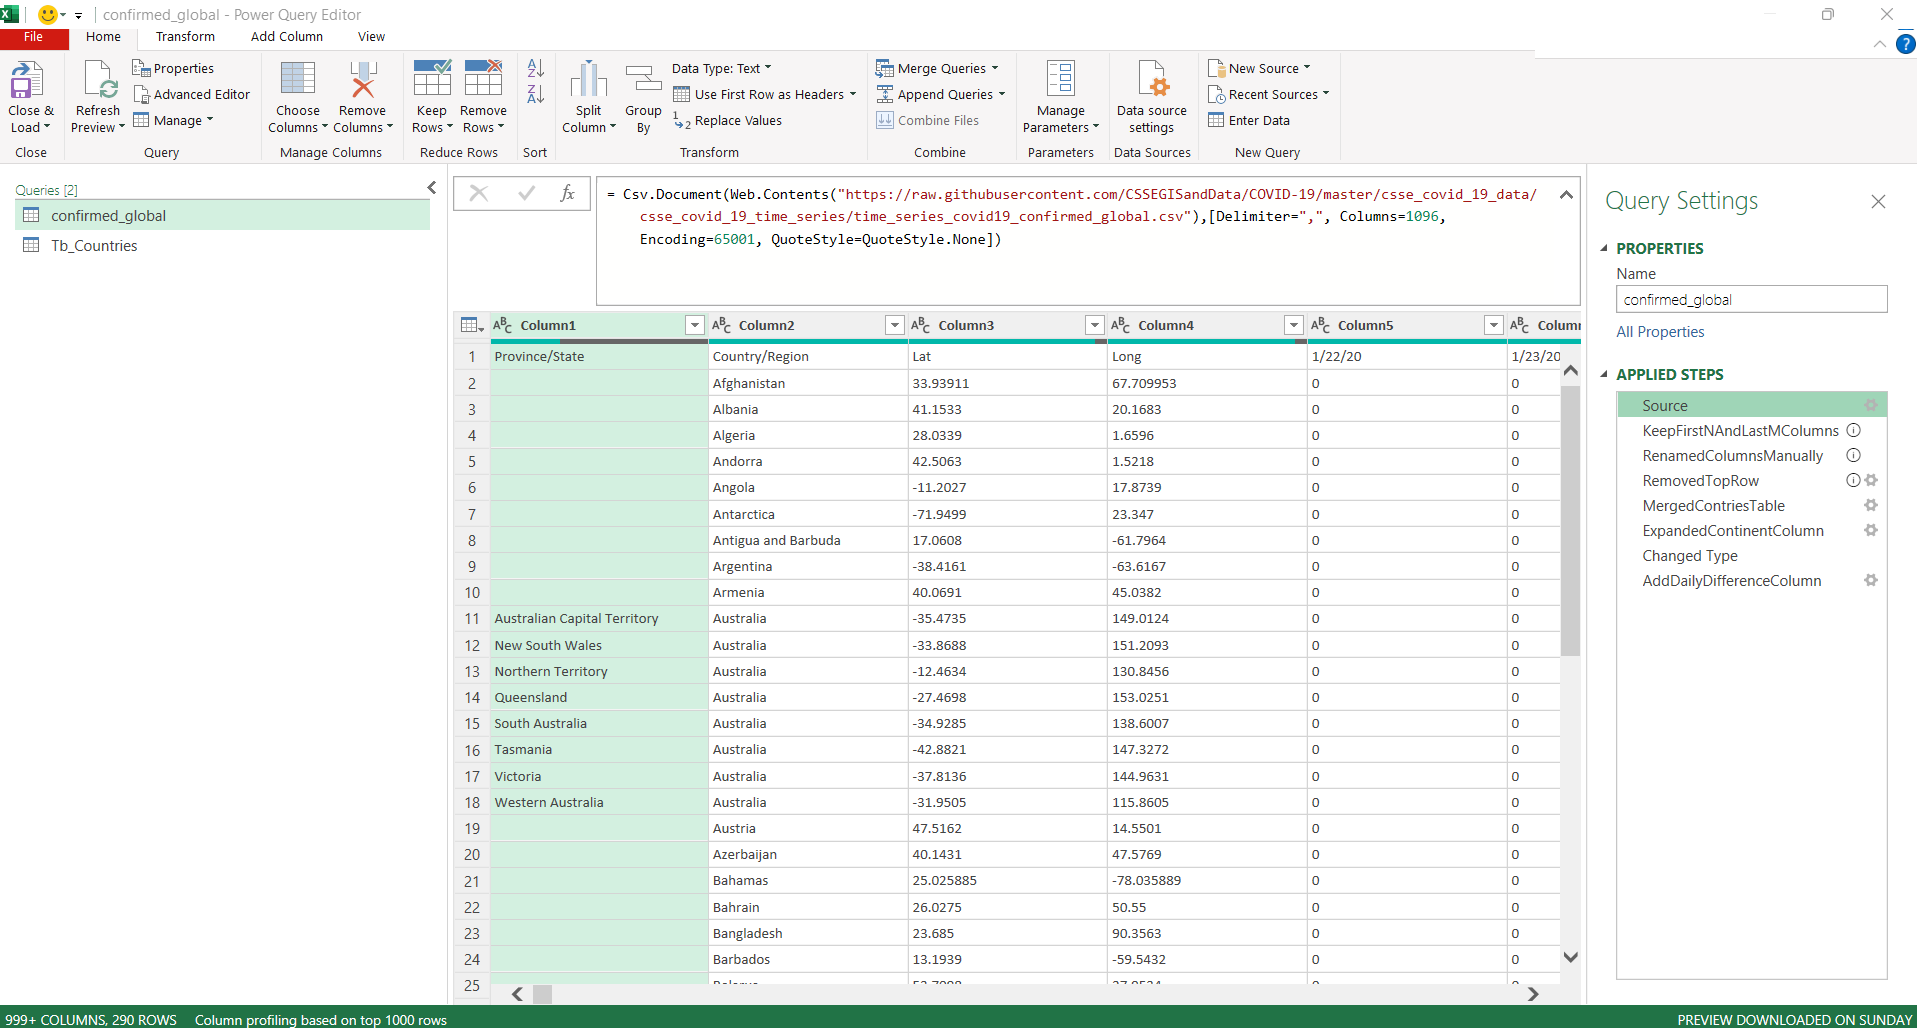
1. Power Query Fetches Live Data

Power Query connects directly to the Johns Hopkins CSSE public GitHub repository. It downloads the latest time-series CSV, then applies data cleaning and transformation steps — no VBA or macros needed for the data pipeline.

Power Query editor showing the data connection and transformation steps

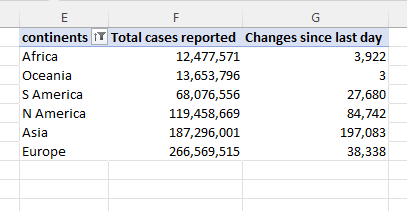
2. Pivot Tables Crunch the Numbers

Behind the scenes, pivot tables aggregate the raw data into meaningful summaries — total cases by country, new cases per day, and global totals. These feed directly into the charts and the PDF report.

Pivot tables calculating country-level case summaries

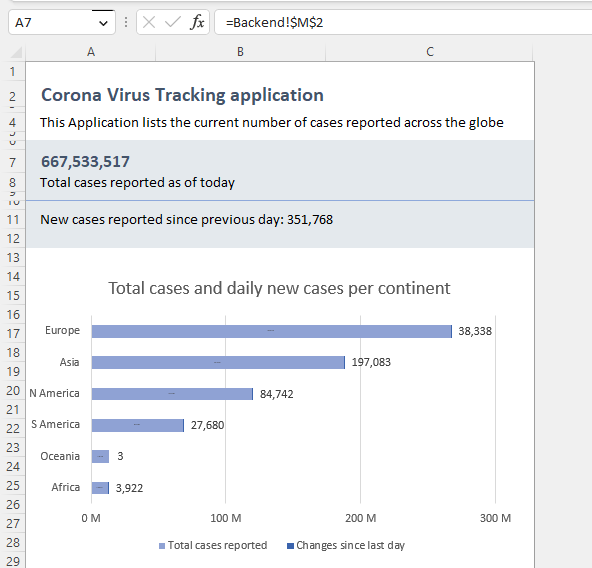
3. Report Worksheet Generates the PDF

A dedicated worksheet is laid out with formulas that pull from the pivot tables, plus embedded charts. The print area is set so it exports directly to a clean, professional PDF.

Report worksheet with formatted tables and charts ready for PDF export

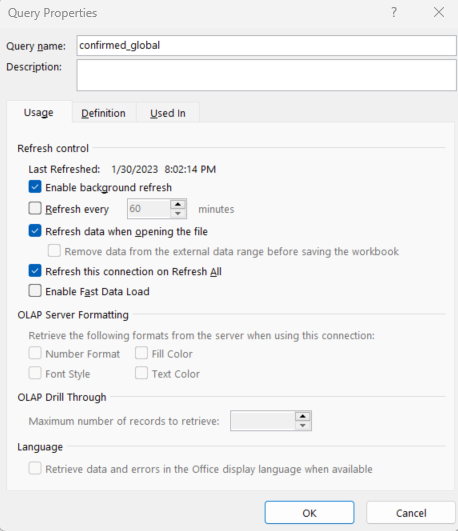
4. Auto-Refresh on Open

Power Query is configured to refresh automatically every time the workbook is opened. Open the file in the morning, and you have today's numbers — no buttons to click.

Power Query connection properties set to refresh on file open

Technologies Used

Excel Power Query Pivot Tables Pivot Charts PDF Export Data Automation

Need an Automated Excel Reporting Tool?

Whether it's pulling live data from APIs, building dynamic dashboards, or generating automated reports — I can build it in Excel.

Get In Touch