Home Services Portfolio Blog Trainings Contact Hire Me

The Challenge & Solution

The client needed an analytics dashboard for their Shopify store, but didn't want to pay for a separate BI tool. Their data already lived in Google Sheets — they needed a way to visualize it that was interactive, attractive, and useful for decision-making.

Instead of using Google Sheets' default chart options, I built a custom JavaScript web app using Google Apps Script that reads directly from the underlying Sheets data. The result is a fully interactive dashboard with filters, KPI cards, and multiple chart types — all powered by data stored in Google Sheets.

The dashboard has 4 dedicated pages, each designed for a different audience and use case within the business.

View Live Dashboard

Data Analyst, Data Engineer & Visualization

Data Layer in Google Sheets

Structured the raw Shopify data into clean aggregation tables — regional revenue, revenue by status, top products by profit — all computed in the Sheets layer.

JavaScript Web App

Built the entire front-end using JavaScript and a charting library, deployed via Google Apps Script as a web app that reads live from the Sheets data.

Interactive Filters

Added dropdown filters for distribution center, order status, and date ranges — so the team can slice the data on the fly without touching the spreadsheet.

4 Dashboard Pages

Designed separate pages for executives, customer/marketing teams, product/merchandising, and operations/logistics — each with the right KPIs and charts.

What I Built

Executive Overview

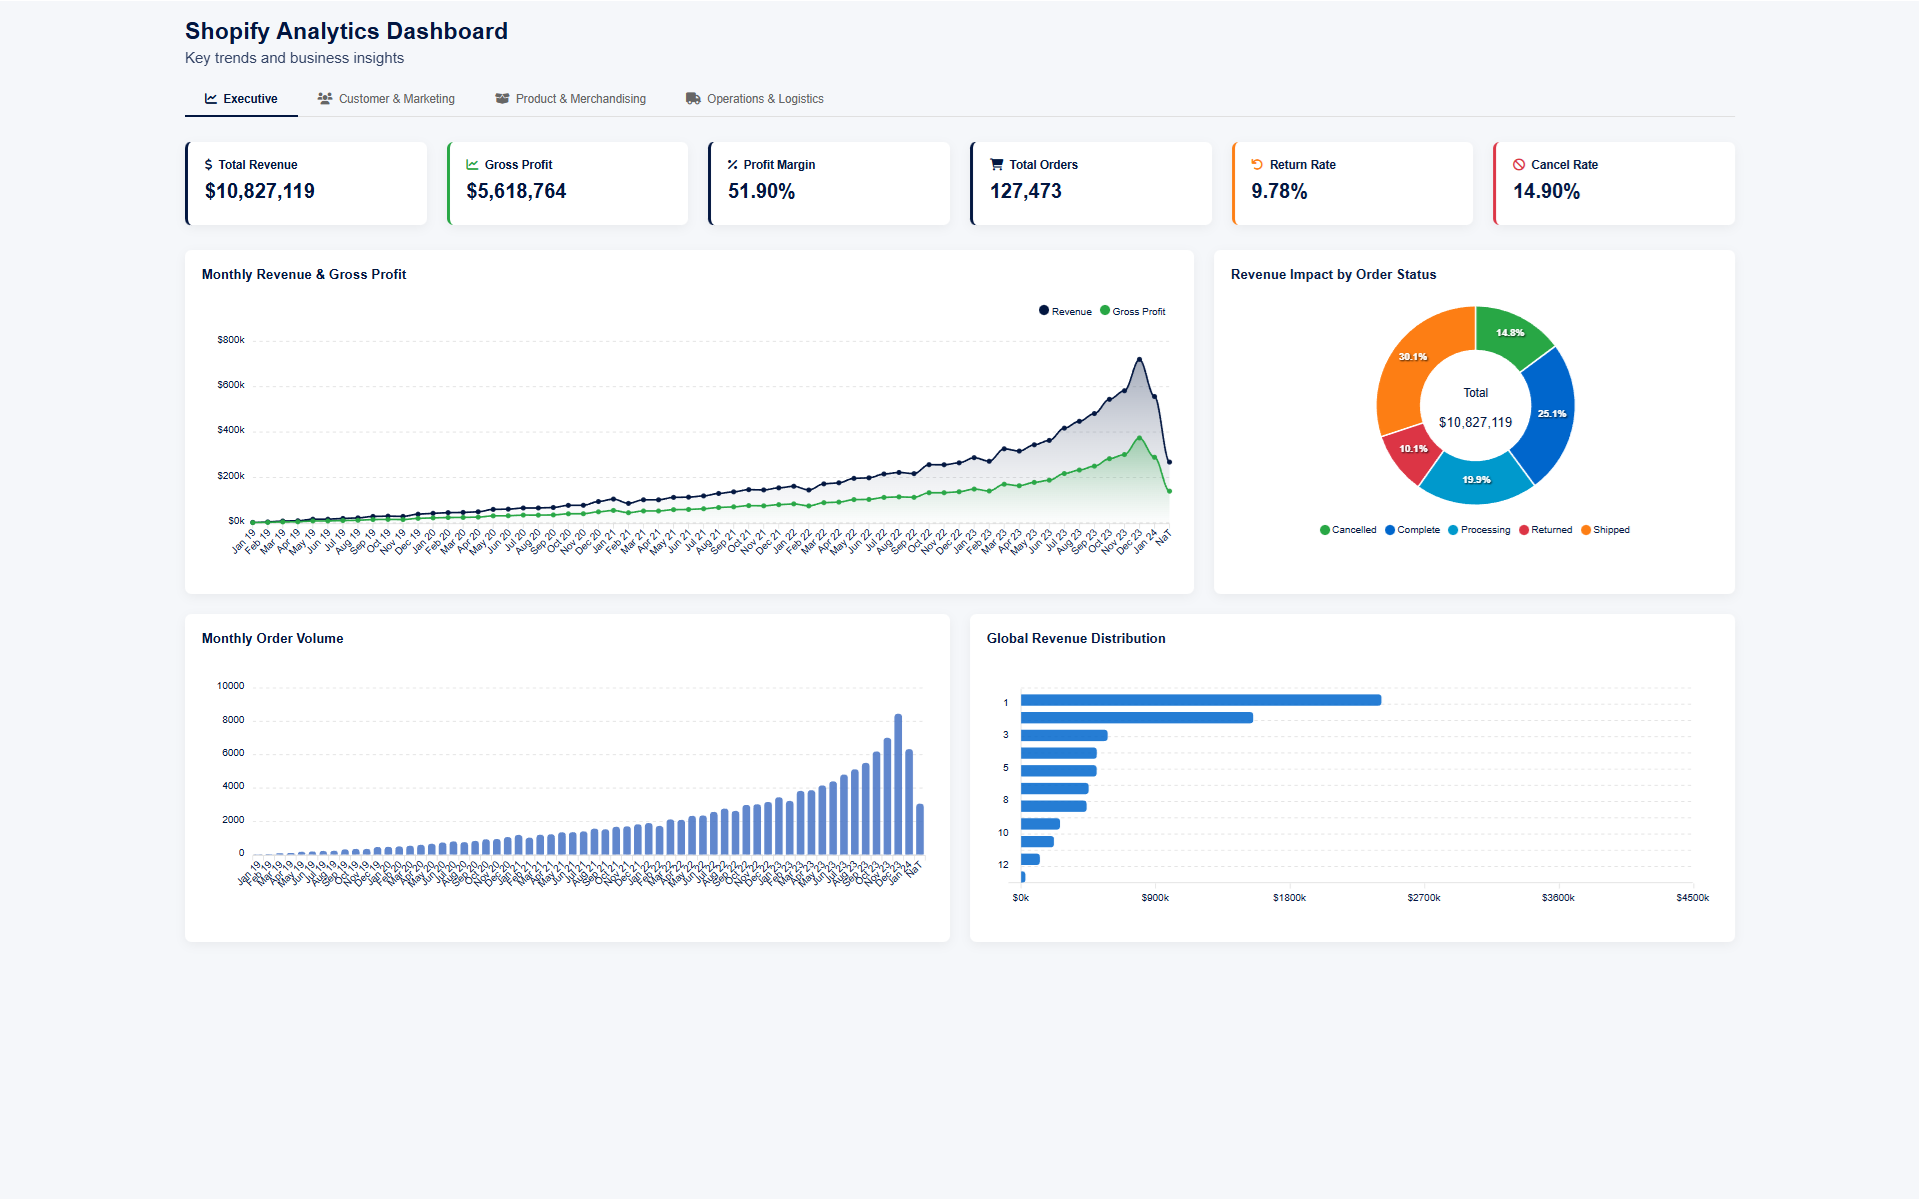
High-level KPIs for leadership: total revenue ($10.8M), gross profit, profit margin (51.9%), total orders (127K), return rate, and cancel rate. Includes monthly revenue trends, revenue breakdown by order status, monthly order volume, and global revenue distribution.

Shopify Analytics Dashboard - Executive Overview showing revenue trends, profit margins, and global distribution

Customer & Marketing

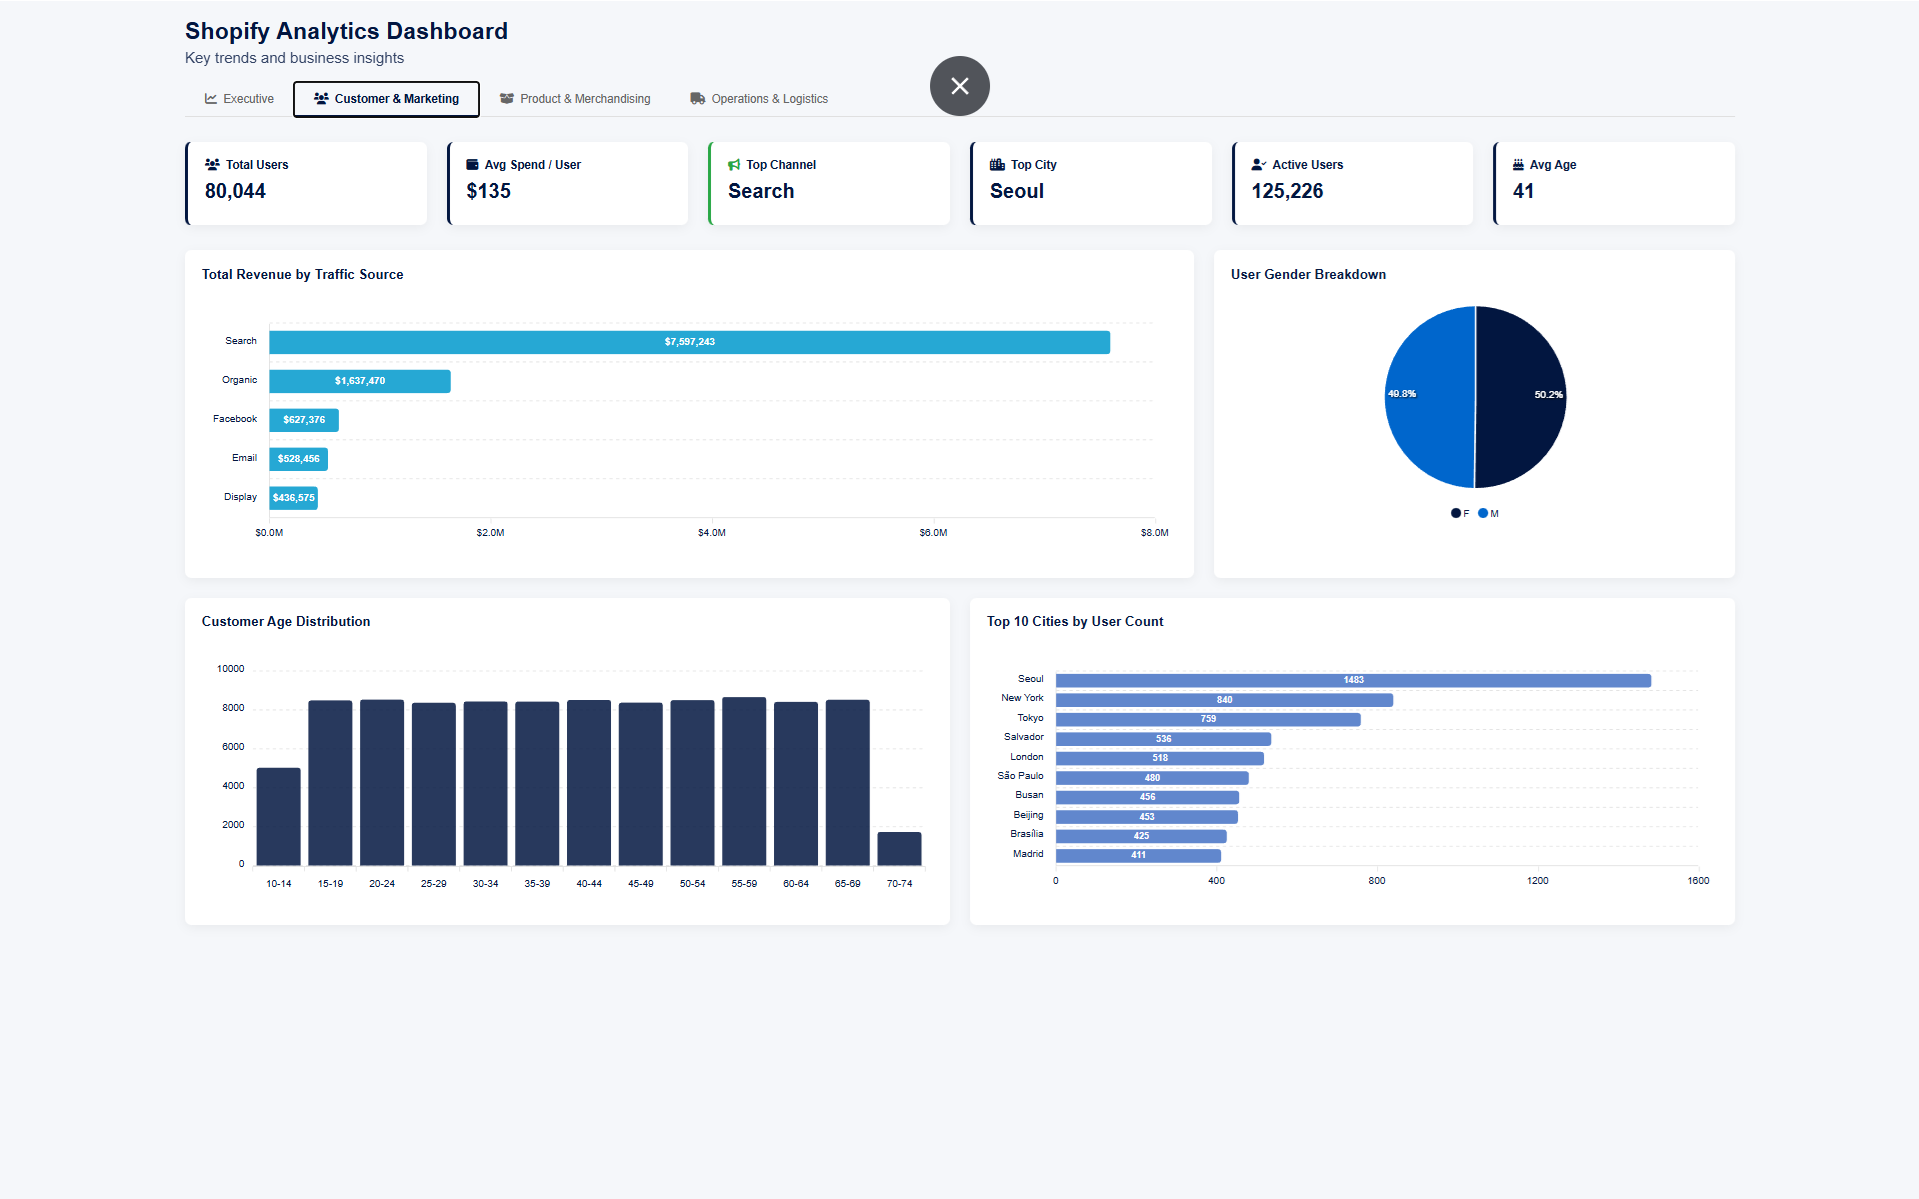
Customer analytics: 80K total users, $135 avg spend, top traffic sources (Search at $7.6M), gender breakdown, age distribution, and top 10 cities by user count. Helps the marketing team understand who their customers are and where revenue comes from.

Shopify Analytics Dashboard - Customer and Marketing page with traffic sources, demographics, and city breakdown

Product & Merchandising

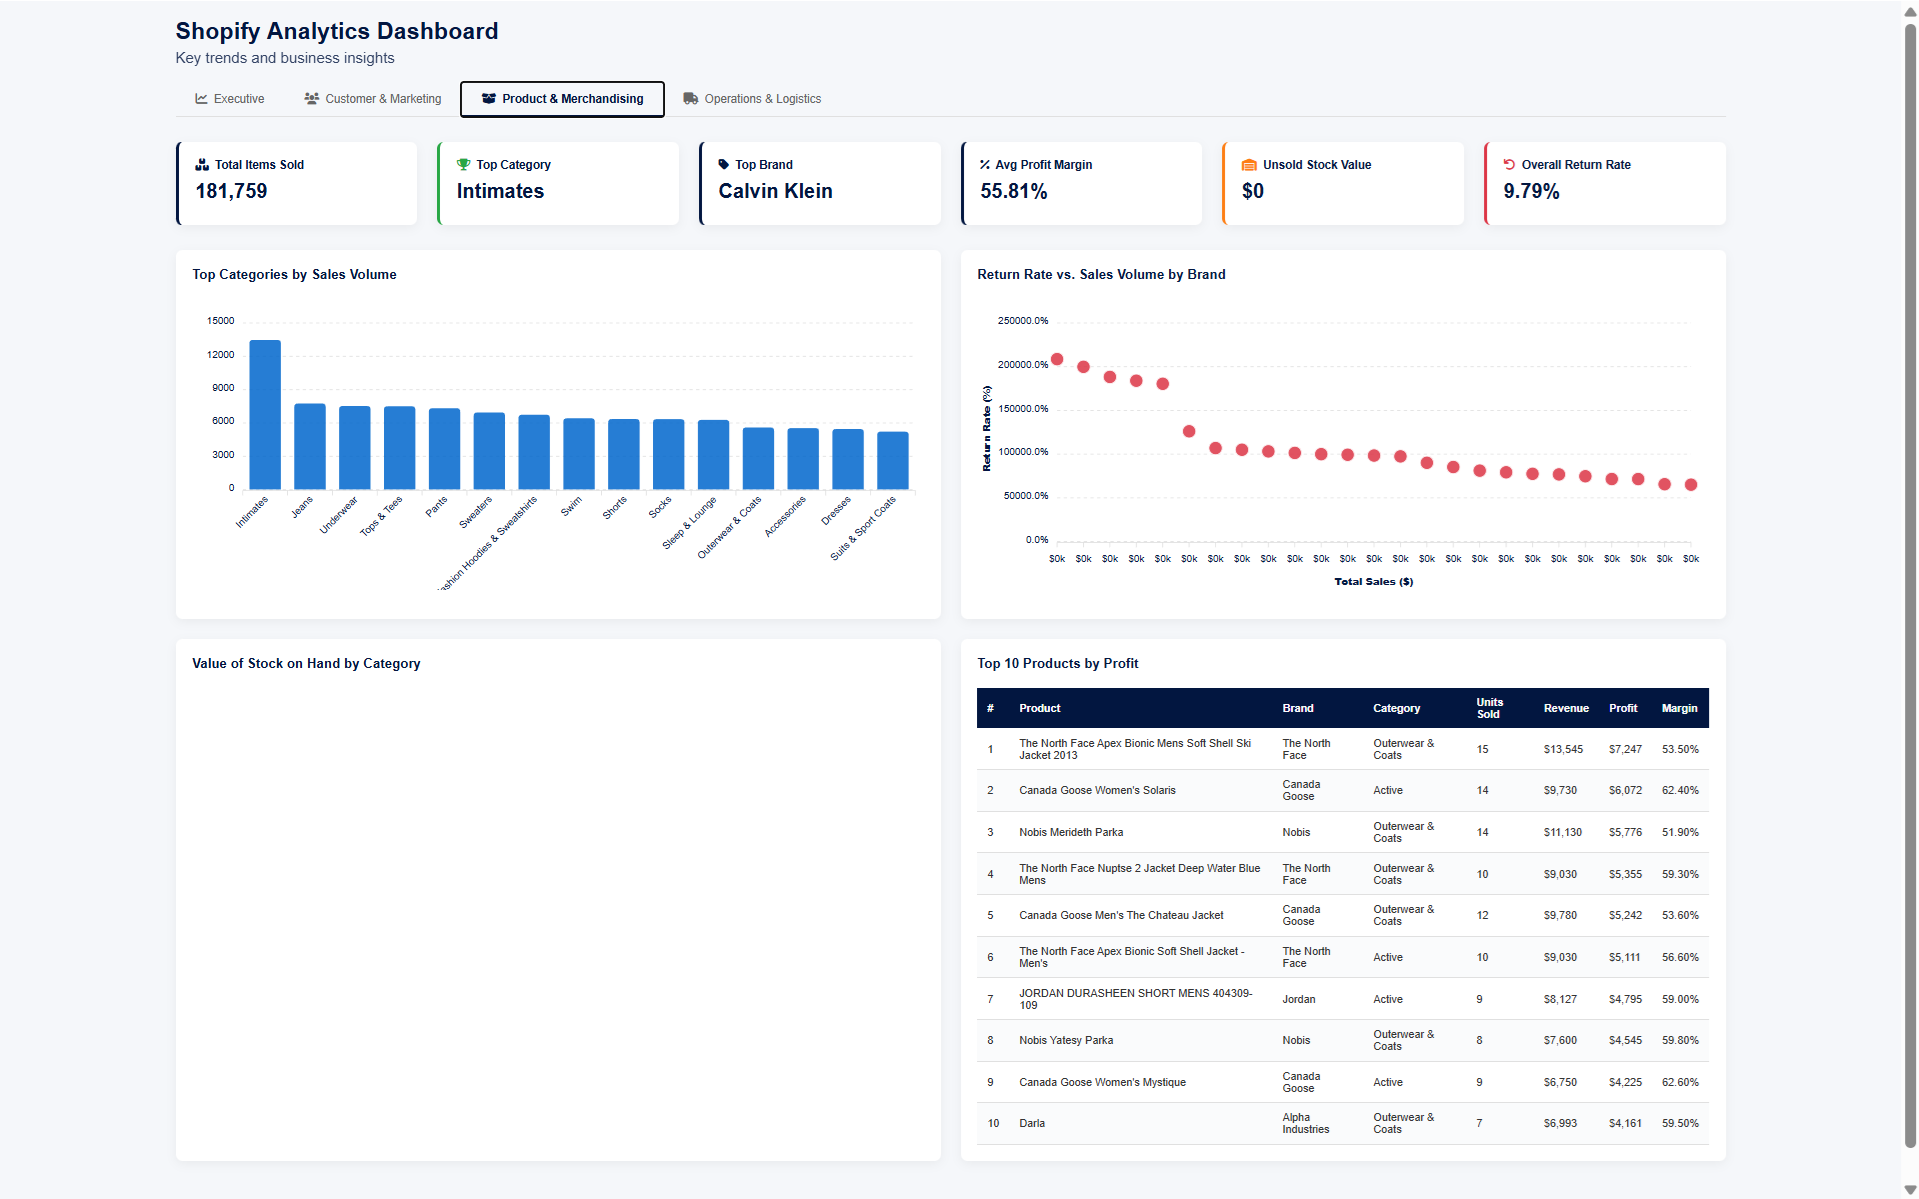
Product performance: top categories by sales volume, return rate vs. sales volume by brand (scatter analysis), stock on hand by category, and top 15 products ranked by profit. Gives the merchandising team data to make buying and stocking decisions.

Shopify Analytics Dashboard - Product and Merchandising page with category analysis, return rates, and top products

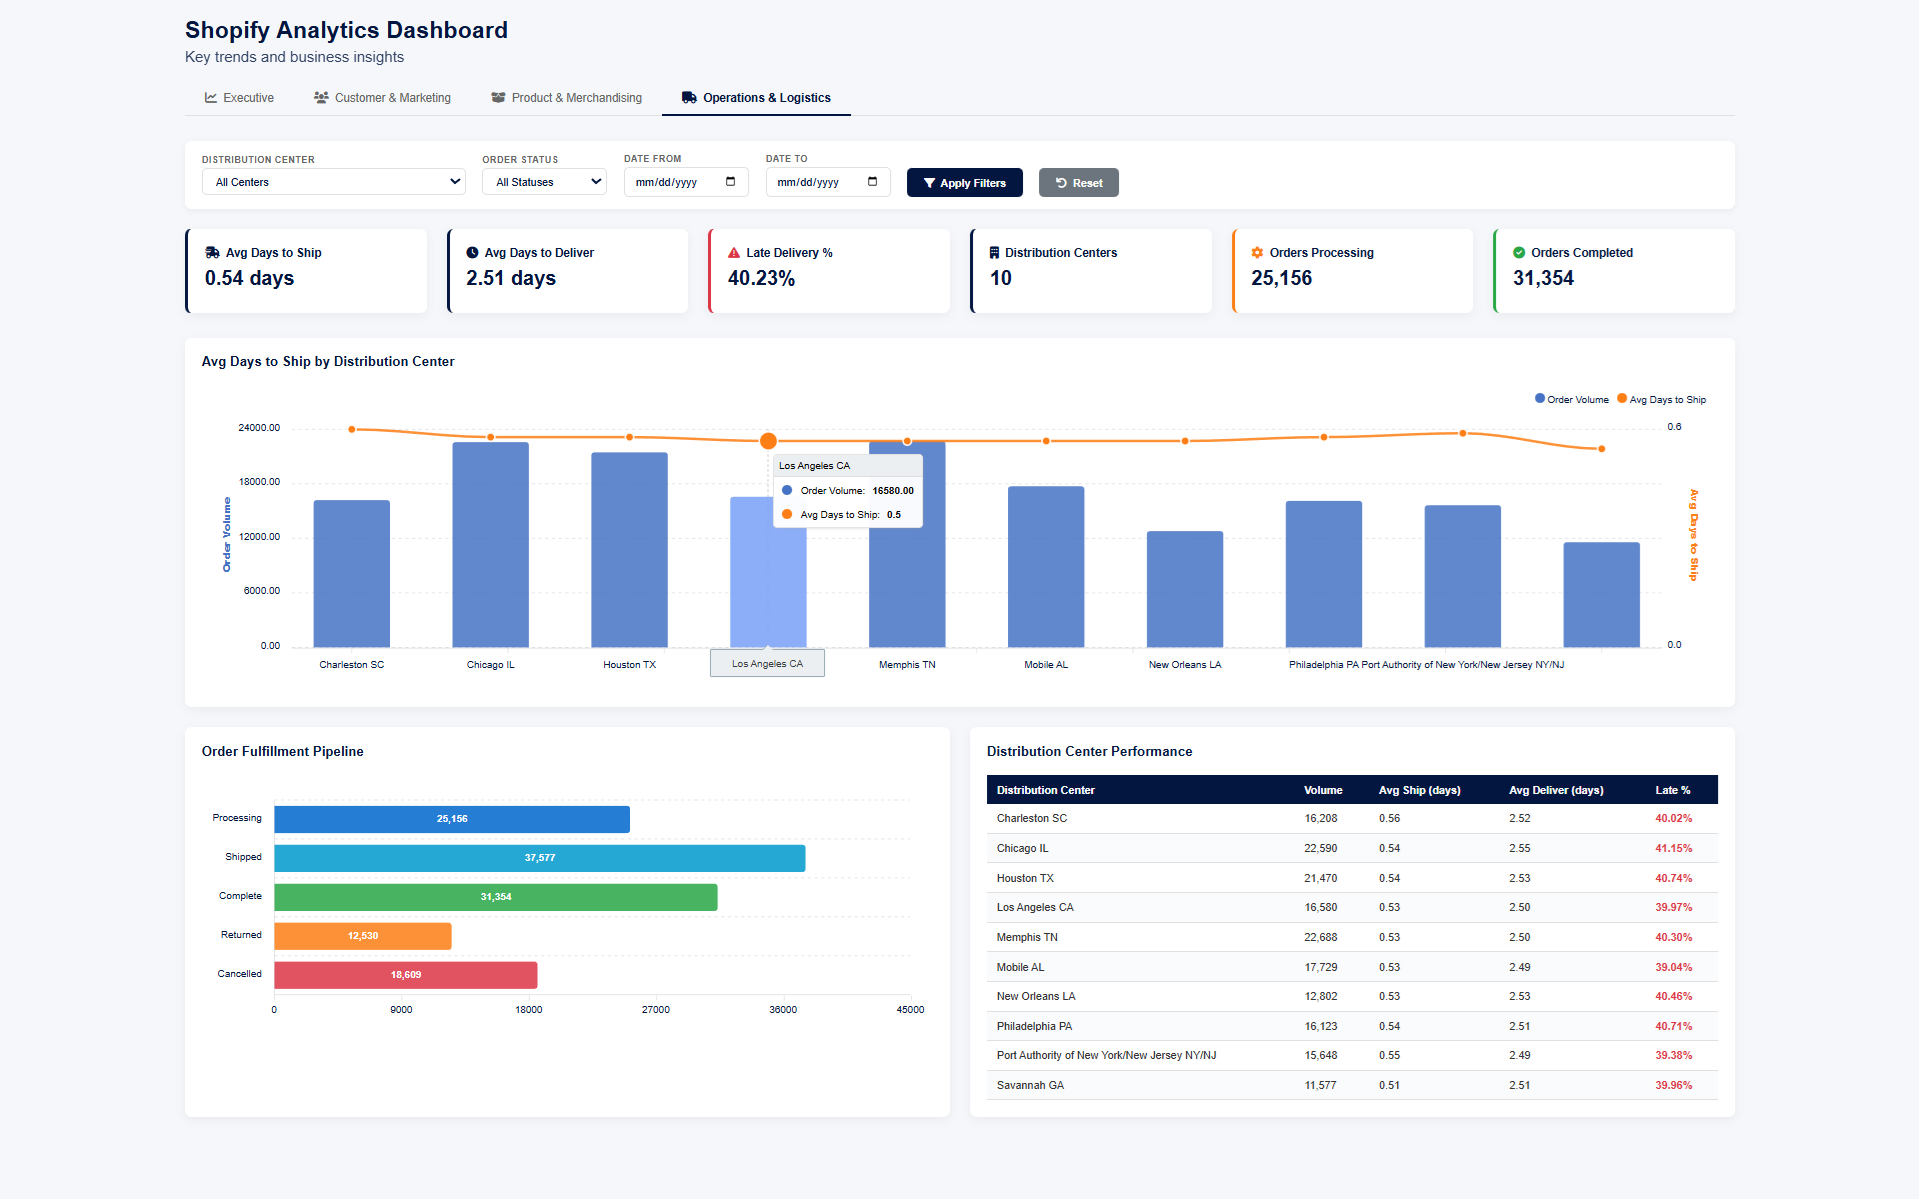
Operations & Logistics

Operational KPIs: avg days to ship (0.54), avg days to deliver (2.51), late delivery rate (40.23%), order fulfillment pipeline, and distribution center performance table with volume, ship times, and late percentages per center. Includes interactive filters for distribution center, order status, and date range.

Shopify Analytics Dashboard - Operations and Logistics page with shipping metrics, fulfillment pipeline, and distribution center performance

Data Layer — Aggregation in Google Sheets

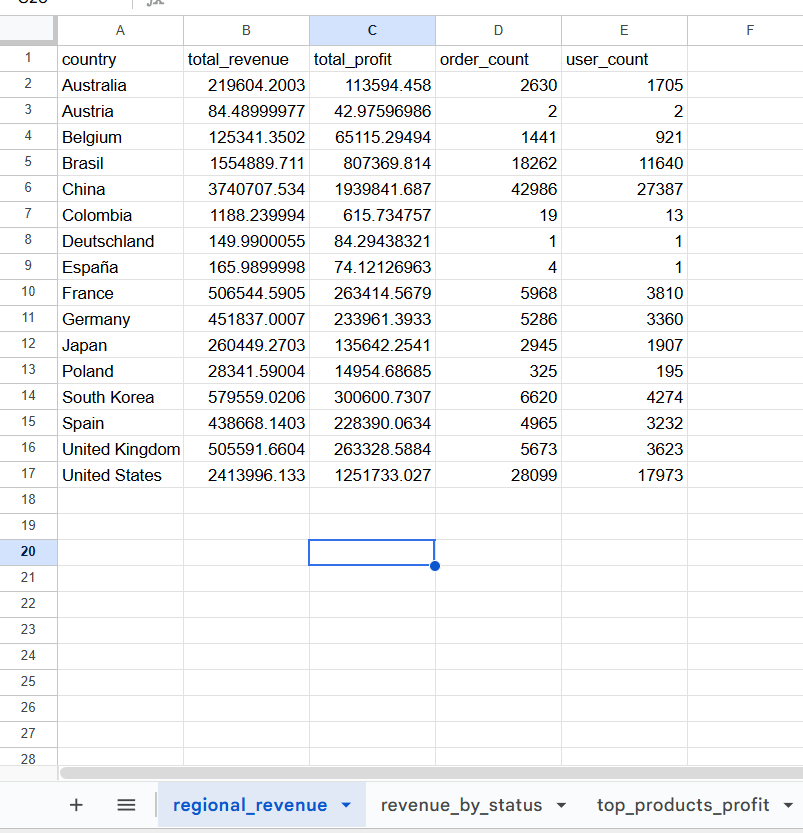
All dashboard data is powered by structured aggregation tables in Google Sheets. Regional revenue, total profit, order counts, and user counts — all pre-computed so the dashboard loads fast and stays accurate.

Google Sheets data layer showing aggregated regional revenue, profit, and order data powering the dashboard

Technologies Used

Google Sheets Google Apps Script JavaScript Interactive Data Visualization Google Sheets Automation Data Analysis Shopify Web App

Need a Custom Dashboard for Your Business?

I build interactive dashboards on Google Sheets, Excel, and Power BI — tailored to your data and your team's needs.

Get In Touch